When getting started with js, one of the first debugging techniques you learn is console.log to see what’s going on. For a variety of reasons, this behaviour sticks. It’s time to level up my friends! There is a better way - the Chrome Javascript debugger.
Here is a gentle introduction to the js debugger, and an example of some neat things you can do with it.
Based on a true story, but I’ve simplified things in this case :)
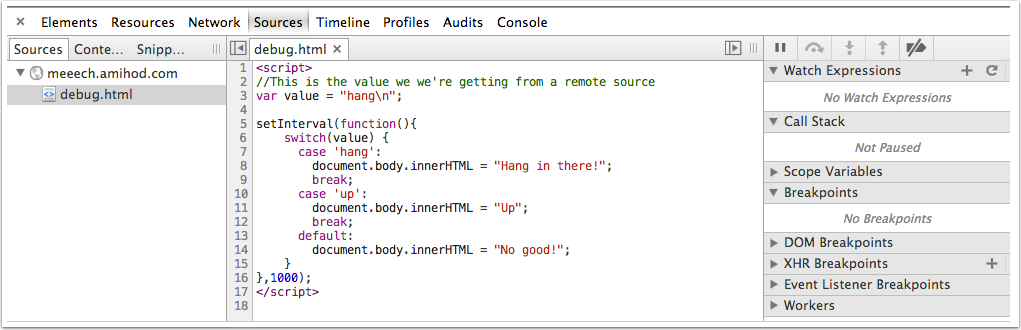
Below is the script we will be debugging. The problem in this case is clear (the extra \n in value). We’ll go through the steps you would use to find this problem with the debugger. You can load this script and follow along: http://meeech.amihod.com/debug.html.
1 2 3 4 5 6 7 8 9 10 11 12 13 14 15 | |
 Pretend
 value is actually coming from a remote source. You inspect the response and don’t notice the carriage return.
We’re expecting that our script will show “Hang in there!”, but instead, we keep seeing “No good!”.
- Open your Developer Tools (View > Developer > Developer Tools)
- Click on the Source tab. Here is where you can find all the scripts running on a page. [The sidebar might not be showing- make it show by clicking on the arrow]. Select the debug.html page.

- You should now see something like this:
- First thing we want to do is see what the
switchstatement thinks itsvalueis. Let’s go ahead, and add a breakpoint. To add a breakpoint, click on the line number - in this case, line 6. The blue mark is showing a breakpoint. Even if you reload the page, the breakpoint will remain.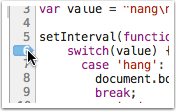
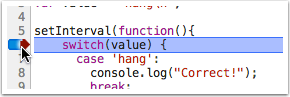
- The script will now pause when it hits the breakpoint - you now see a red mark.
- Right-click on
value, and select “Add to Watch”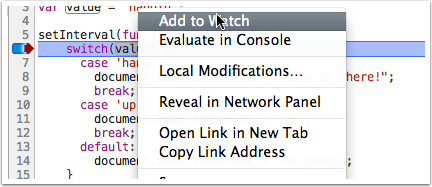
- Over on the right in Watch Expressions, you now see
value. And you can clearly see the carriage return symbol that’s part ofvalue.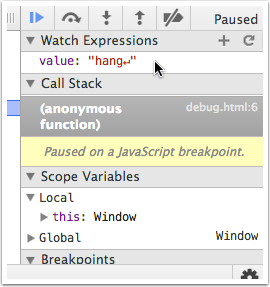
And we’ve found our problem. But that’s not all! While we’re here, let’s just make sure our switch statement works, given the right input. We can change what’s inside value without reloading the script.
- Right-click on
valueand select “Evaluate in Console”.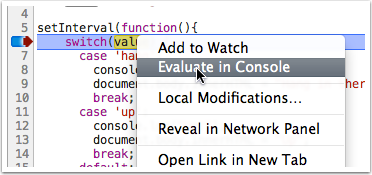 A console should open
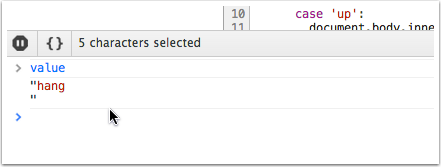
- Inside the console type
value='hang'. Then, start the script running again by click on the Play button over on the right.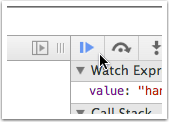 You should now see “Hang in there!” on the page, and the script will pause again at the breakpoint. This time, put
 value='up'and click the Play button again.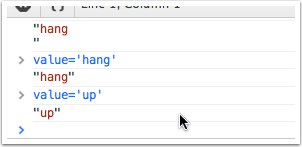
This only scratches the surface of what you can do in the debugger - click around the panels on the right. Hopefully this will help you get started using it.